

Analytics
Analytics shows one bot’s activity: how many requests it handled, where they came from, how many tokens its AI replies used, and how visitors rated its answers.
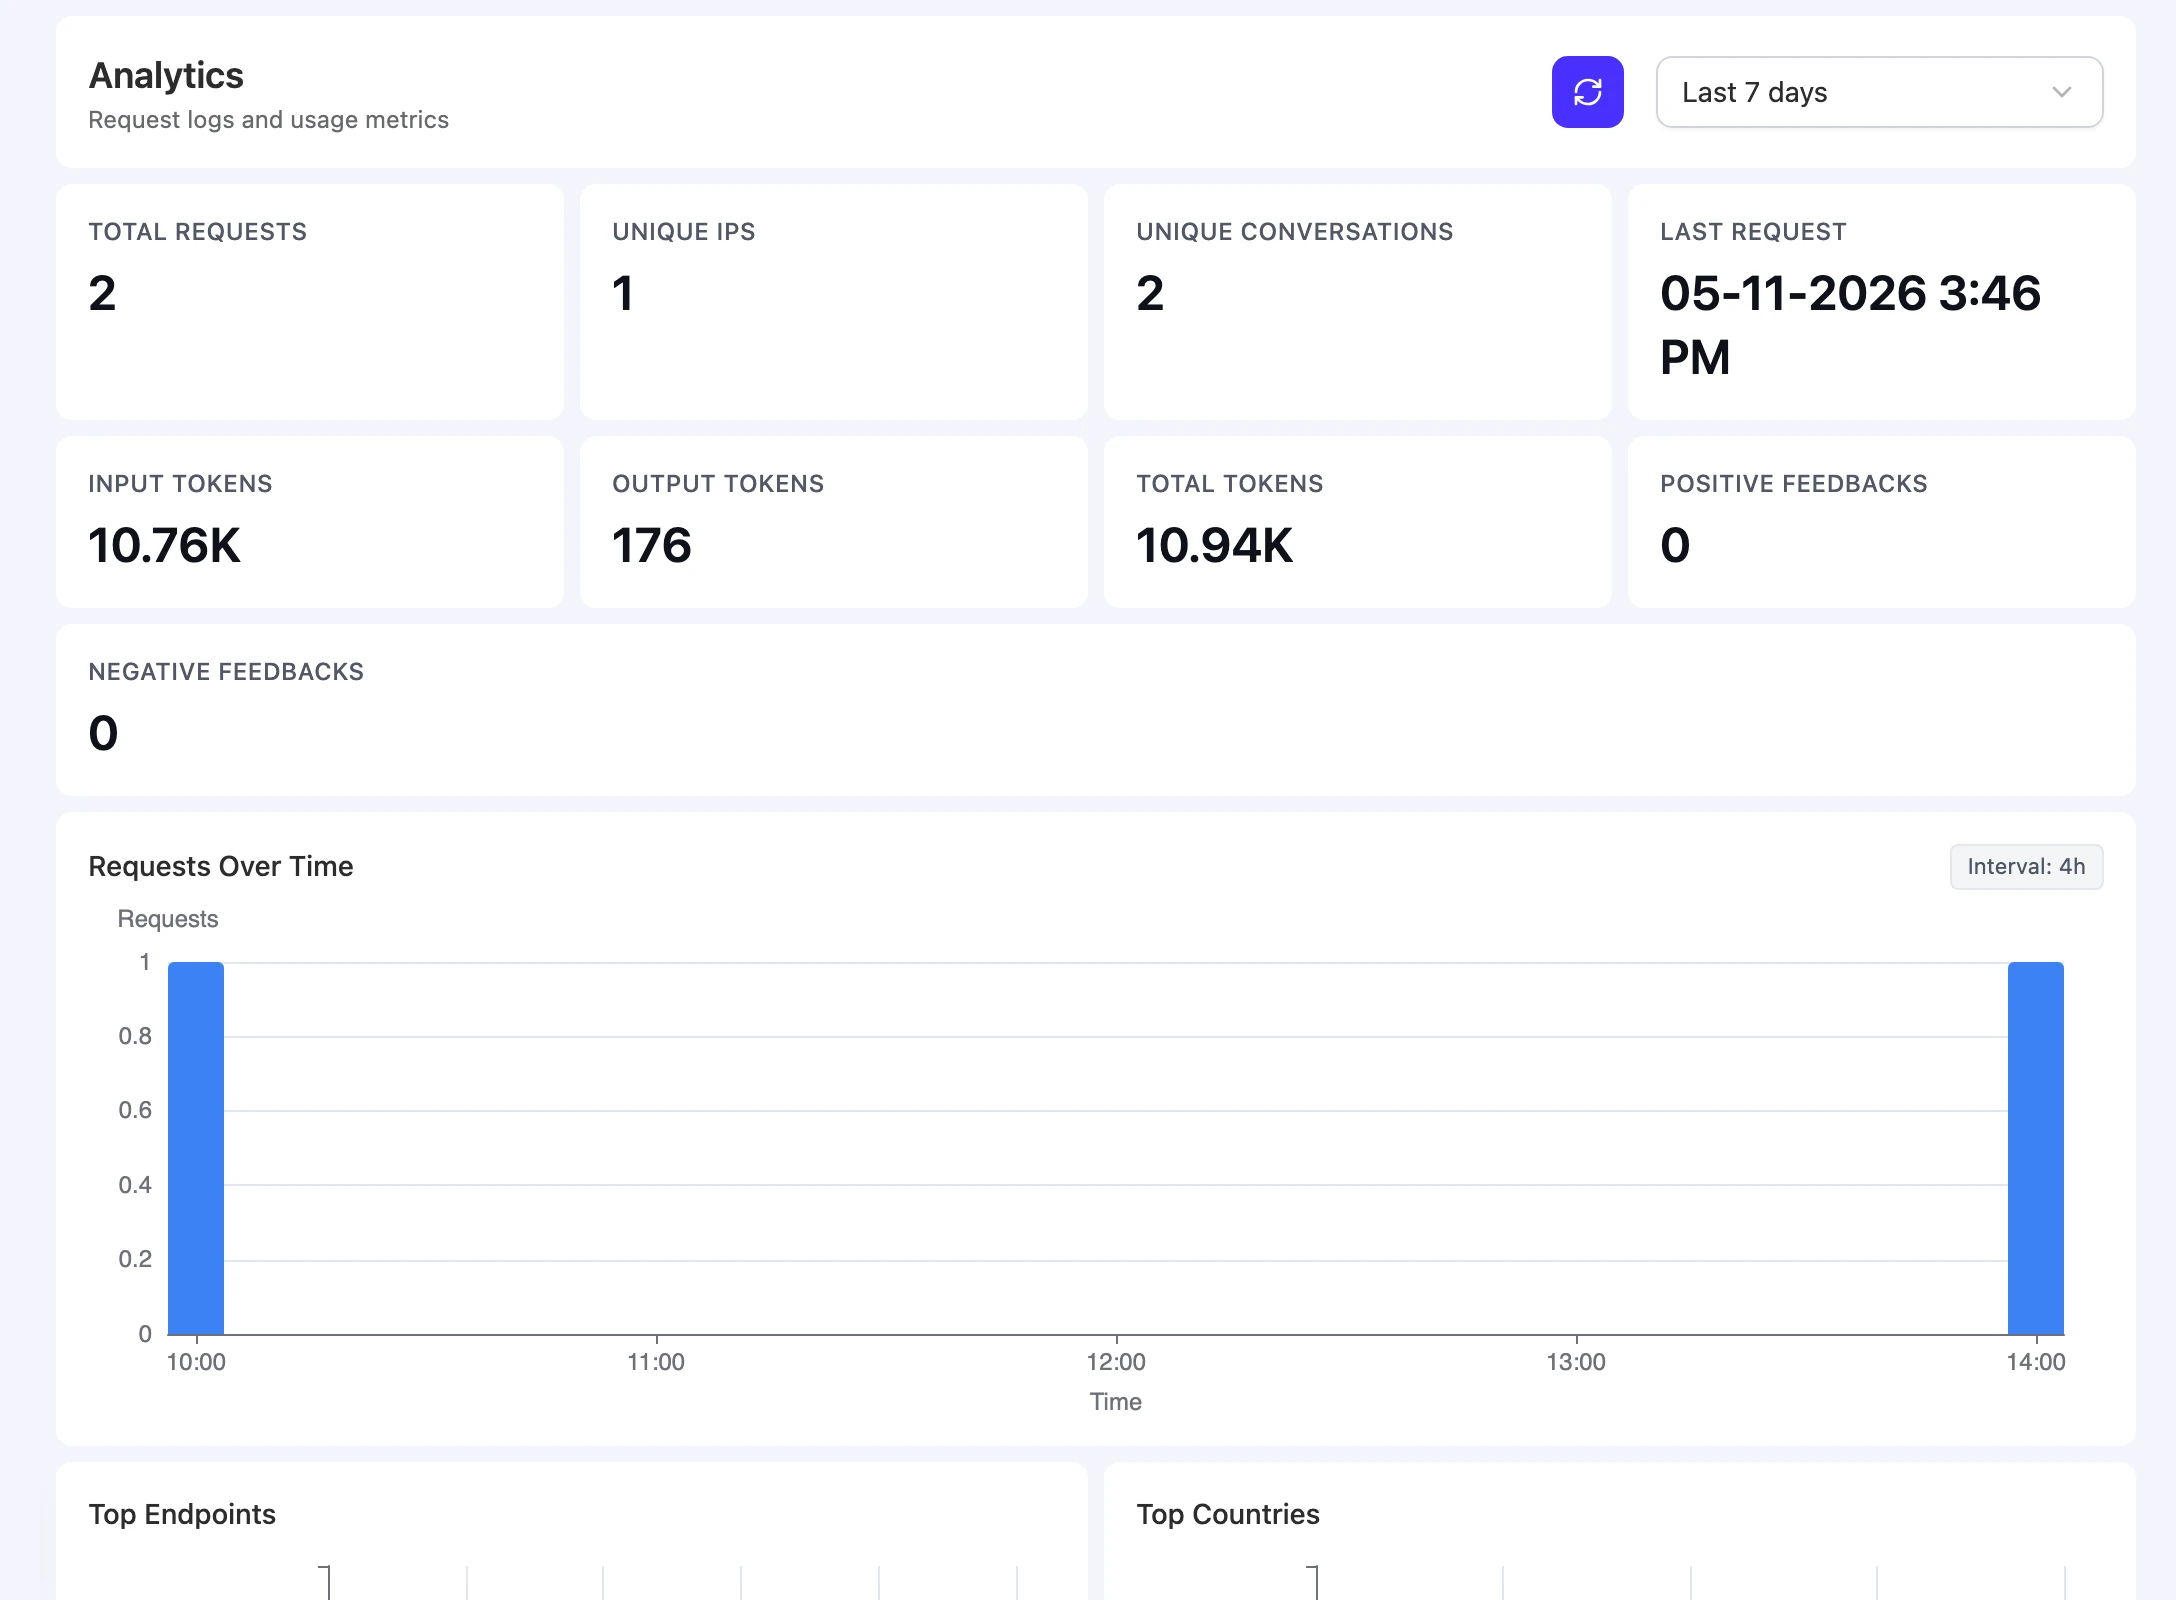
Open Bot > Analytics, under Statistics. The page subtitle reads “Request logs and usage metrics”. From top to bottom it has a date range, summary cards, the Requests Over Time chart, Top Endpoints and Top Countries, the Requests table, and the Token Usages table.
Before you start
- You need access to this bot. Any team role can be given bot access.
Choose a date range
-
Open the range menu. It defaults to Last 7 days.
-
Pick a range. Choose a preset from Last 30 minutes to Last 1 month, or Custom range and set the start and end, then select Apply.
-
Refresh if needed. Select Refresh to reload the data without changing the range.
Summary cards
| Card | What it counts |
|---|---|
| Total Requests | Requests the bot received in the range. |
| Unique IPs | Distinct IP addresses. For ranges of a day or more, this adds up each day’s count, so a visitor who returns on several days is counted once per day. |
| Unique Conversations | Conversations that started in the range. |
| Last Request | When the most recent request arrived. For ranges of a day or more, this is shown to the day. |
| Input Tokens | Tokens sent to the AI model. |
| Output Tokens | Tokens the AI model generated. |
| Total Tokens | Input plus output. |
| Positive Feedbacks | Thumbs-up ratings on answers. |
| Negative Feedbacks | Thumbs-down ratings on answers. |
Tokens measure AI processing. They aren’t the same as the Messages count on Billing. See Usage.
Charts
| Chart | What it shows |
|---|---|
| Requests Over Time | Request volume in buckets. The bucket size depends on the range. |
| Top Endpoints | Which endpoints received the most requests. |
| Top Countries | Which countries sent the most requests. |
Requests table
One row per request, with Time, Endpoint, IP, Country, Region, City, and Browser. Type in the Endpoint, Country, or IP boxes to filter. Each box matches part of the value.
Select Export and choose Export CSV or Export JSON to download every matching row for the current range and filters. Pagination doesn’t limit the export.
Token Usages table
One row per AI usage record, with Time, Source, Input, Output, and Total. Use the Source menu to show one kind:
| Source | What it covers |
|---|---|
| All Sources | Every record. Some records, such as agent reply suggestions, appear only here. |
| Chat | Bot replies on website channels, the API channel, and the Playground. |
| FS Chat | Replies through the Fluent Support channel. |
| Responses | Requests to the Responses API. See REST API. |
| Ticket Summary | Older Fluent Support ticket-summary records. FluentChat doesn’t currently add new ones. |
Select Export and choose Export CSV or Export JSON to download every matching row for the current range and source.
A reply served from FluentChat’s answer cache doesn’t use the AI model, so it adds no token row.
Document Usage
Document Usage, under Statistics in the bot sidebar, shows which documents the bot uses to generate responses. See Document Usage.
Limitations
- Unique IPs is approximate for multi-day ranges. It sums daily counts.
- Analytics doesn’t match Billing. Billing counts messages against your allowance. Analytics counts requests and tokens. See Usage.
- Ratings cover answers only. Star ratings for whole conversations are in the team Analytics under Ratings.
Troubleshooting
”No request data” or “No token usage data”
Possible cause: The bot had no traffic in the selected range.
Solution: Pick a longer range. Check Conversations to confirm the bot has had chats.
Token totals look higher than expected
Possible cause: Longer answers, broader questions, or recently added sources can increase the context the bot uses.
Solution: Filter Token Usages by Source to see which kind of activity uses the most tokens.